
Marketers today have more control over their advertising investment than ever before. By control, I mean marketers have many options for how to spend their ad dollars, very little commitment in terms of minimum spend levels, and rich data to pour through to measure results. Marketers can reallocate their ad budget weekly, daily, even hourly for certain channels. Despite this flexibility, however, many marketers still use antiquated methods to optimize their ad budgets. Here are six tips to help you systematically boost your marketing performance.
Optimize Using Marginal Results, Not Average Results
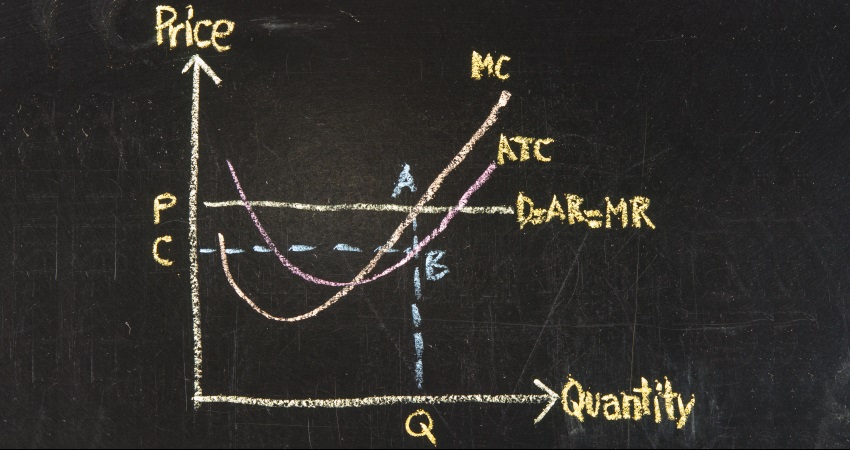
Back in grad school, I had a micro-economics professor discuss profit maximization ad nauseam. As he drew countless supply and demand charts for various companies, he kept drilling in the point that profit maximization occurs where marginal revenue equals marginal cost. He said “if you remember nothing else from this course, remember firm-level profits are maximized where MR = MC”. Well, that’s my paraphrase, but it was along those lines.
If your ad mix is even remotely optimized today, the next dollar you spend produces fewer sales than the previous dollar.
Surprisingly, I find this concept frequently violated among marketers in lieu of measuring performance based on average results. Why? One reason is because it can be difficult to measure marginal productivity due to non-linear productivity (diminishing returns).
At the most fundamental level, what I’m saying is this: don’t invest the next advertising dollar if you know you’ll spend more than you’ll ever recover. The performance of most marketing efforts, however, is measured based on average results, not marginal results. If your ad mix is even remotely optimized today, the next dollar you spend produces fewer sales than the previous dollar. The problem is not all campaigns perform the same and your best performing campaigns are subsidizing your poorest performing campaigns.
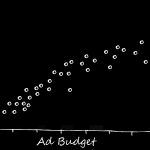
How do you measure marginal productivity? A basic marginal productivity curve can be developed in Excel. Start by measuring aggregate results by taking historic results for one channel aggregated at a weekly level going back in time for ideally 2 years or more (actually 5 years is better), and perform a regression using Excel’s data analysis toolpack. Here’s an example using one advertisers experience in paid search campaigns:
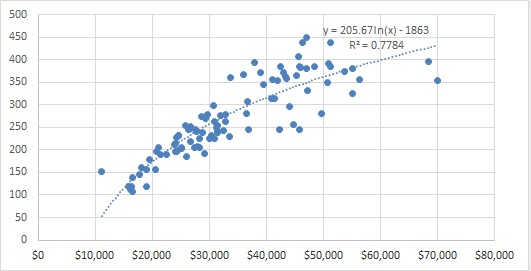
This advertiser has historic weekly paid search spend varying from around $15,000 to $70,000. The y-axis is sales volume. Notice the diminishing return. The more you spend, the less you get (on the margin). A simple log fit produces the fitted line you see above with a 77.8% R2 fit. Not bad. But when you incorporate other factors at the weekly level such as seasonality of industry-related search volume from Google Trends, advertising from other channels (like TV, radio, direct mail, etc), competitor activity, and dummy variables on structural changes in the advertisers website that affected throughput, the R2 on a multiple-regression model improves to 87.7%.
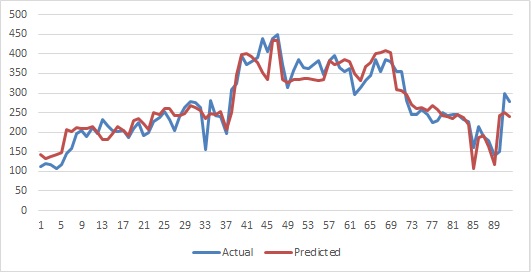
Using the multiple-regression model, you can see the prediction fits weekly actual results over time with a few exceptions:
Now that we have a basic model, we can predict sales at various paid search budgets holding seasonality constant. Using our regression function, here’s a plot of predicted sales and the marginal cost per sale at various spend levels.
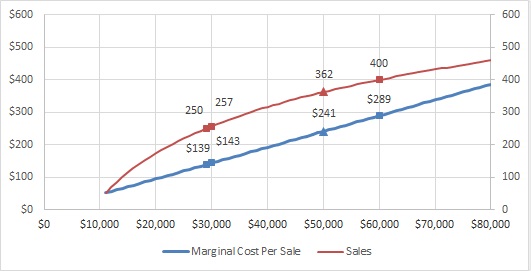
Notice that as the budget grows, predicted sales grow at a decreasing rate. If we divide the increase in spend by the increase in sales we can measure the marginal cost per sale. For example, when spend increases from $29,000 to $30,000, sales grow from 250 to 257. That’s seven incremental sales for $1,000 in incremental spend, or ($1,000 / 7 = $143) marginal cost per sale. Likewise, the marginal cost per sale at $50,000 in spend is $241, and at $60,000 in spend is $289. This is our marginal cost curve. At much higher spend levels (above $80,000) this curve will reflect an exponential slope.
To calculate marginal revenue, remember that there are other costs the company incurs to service customers outside of marketing. Unless you factor those costs into your marginal cost function, you cannot include all company revenue either. One approach is to take all contribution margin above fixed + non-advertising variable cost. In other words, the advertising budget as a % of revenue plus the target profit margin. For example, if you have a 5% allocation for marketing and a 15% target profit margin, the number is 20%. Department leaders in other parts of the company may argue with this approach, but let’s be honest, as the marketing lead, you’re generating incremental revenue at a specific cost and a profitable margin. What revenue did that IT project produce? Plus, If you have opportunities to generate additional profitable revenue, most CEOs would tell you to go for it even if it’s below the target margin. Revenue is king, just don’t lose money.
For this company, the two figures were 3% and 5% (measly margins), so the target (breakeven) figure was 8% of total revenue. For this advertiser, paid search as a channel produced an average lifetime revenue per customer of $3,000, making the marginal revenue in our calculation $240 (8% of $3,000). Some advertisers may refer to this as a marginal allowable.
Now back to our marginal cost curve. This company would achieve profit maximization in this channel at a spend level of $50,000 where the marginal cost of $241 is equal to marginal revenue of $240 (close enough). Keep in mind that’s the marginal cost per sale of the last $1,000 spent, and the average cost per sale is only $138 ($50,000 / 362). Think of that as the most you can spend on paid search profitably (where the last dollar spent is still making money). Many factors will affect this marginal cost curve such as seasonality in demand, ad copy wearout, competitors driving up the cost per click, etc. so the target budget figure should vary throughout the year based on these other factors to stay profitable. Did I mention your CFO will love you for this?
One other concept emerged from this exercise, which is the profit maximizing marketing budget. In this channel, profit maximization occurs at $50,000, which is an average cost per sale of $138. $138 is 4.6% of lifetime revenue from this channel, which means the 3% target advertising budget in this scenario is not the profit-maximizing budget. The under-investment is leaving money on the table.
The key for long-term investments like branding is discovering the lag functions that connect the timing of the advertising spend to the timing of the lift in sales.
Even though this scenario highlights a direct marketing channel, the same rules apply to brand marketers. I’ve met many marketers who exempt brand spend from any responsibility of producing sales because it’s a necessary expense to reposition the brand, to build a long-term value proposition, etc. This is when you hear words like primary, secondary and “tertiary” goals. The truth is, even long-term investments can be measured according to marginal productivity curves, which will allow you to determine your profit maximizing outcome. The key for long-term investments like branding is discovering the lag functions that connect the timing of the advertising spend to the timing of the lift in sales. You also need a good attribution method that can identify the lift in sales across all channels that occurs from brand advertising.


Recent Comments